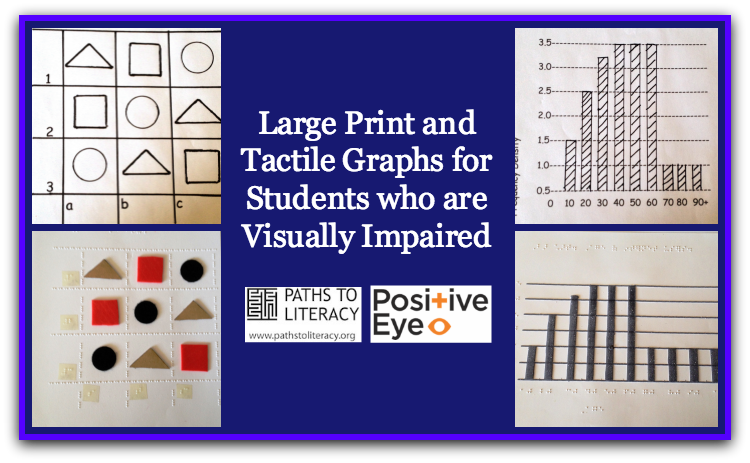
Graphs and charts can be very challenging for students who are blind or visually impaired, whether they are using tactile graphs or large print graphs. Students with visual impairments must be specifically taught how to interpret tactile graphics and these skills are essential to success in later grades in all subjects, but especially in math and science.
In this post I have included examples of different types of graphs and charts, including pie chart, tally charts, bar graphs, co-ordinates, and line graphs, at both the primary and secondary school levels. Examples are included for tactile graphs and charts, as well as large print versions for each.
Pie Charts
Primary Pie Charts
Materials: Paper plate with thick cardboard used to make the “pie pieces”
Sample question:
My first pie chart
Ben and Jen made a jam pie. They cut it up.
They gave some to mum and dad.
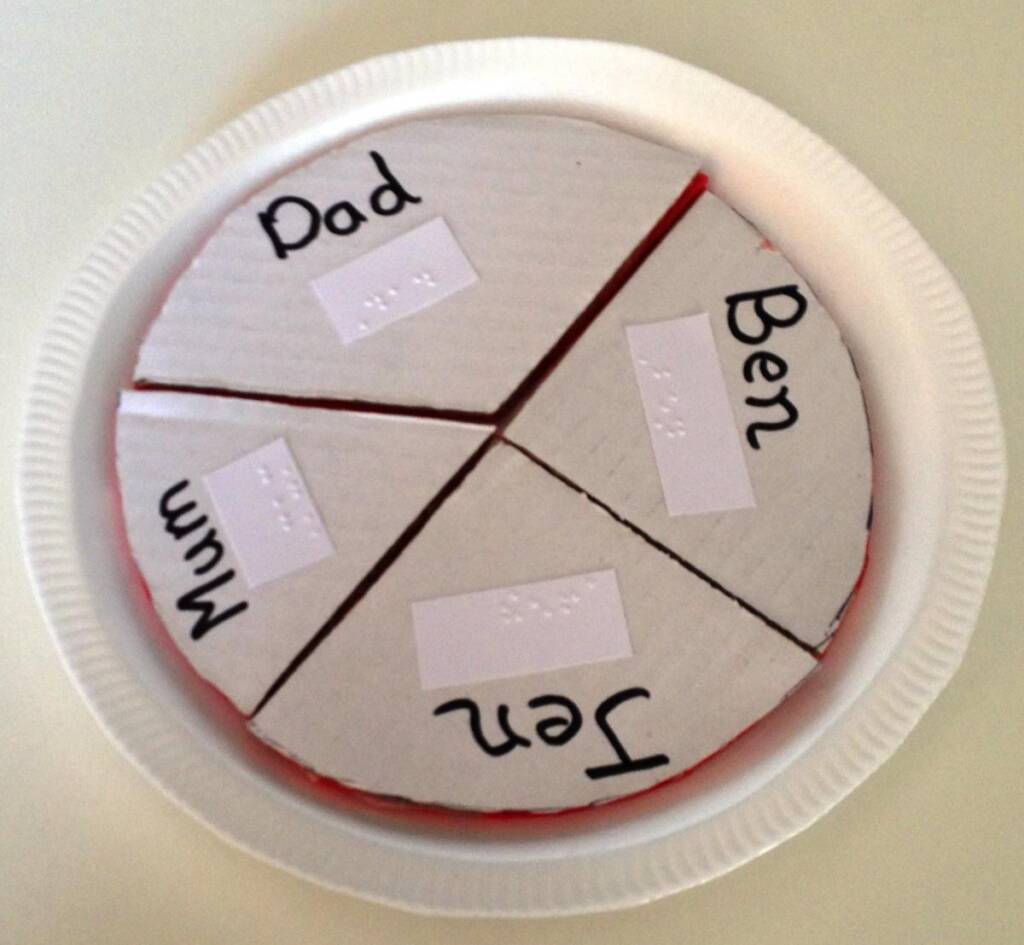
- How many pieces can you count?
- Which pieces are the same?
- Who had the biggest piece?
- Who had the smallest piece?
Secondary Pie Chart
Sample question:
“Reducing Traffic”
This pie chart shows how many people travel in one car. The government target to get two or more people in one car is 40%.
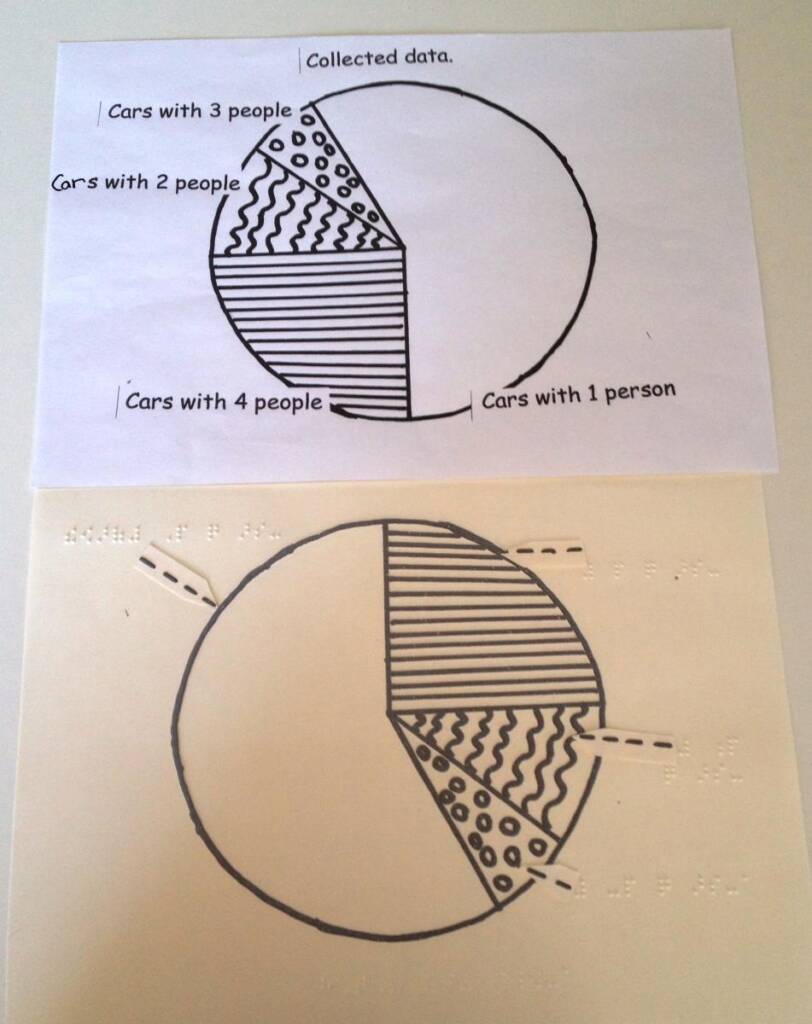
Has the government met its target from the data shown here? Explain your answer.
Further examples of pie charts:
Tactile colour used to identify each area of the pie chart.
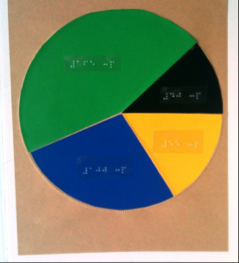
Made on Zyfuse paper, lines raised using Zyfuse machine.

Tally Charts
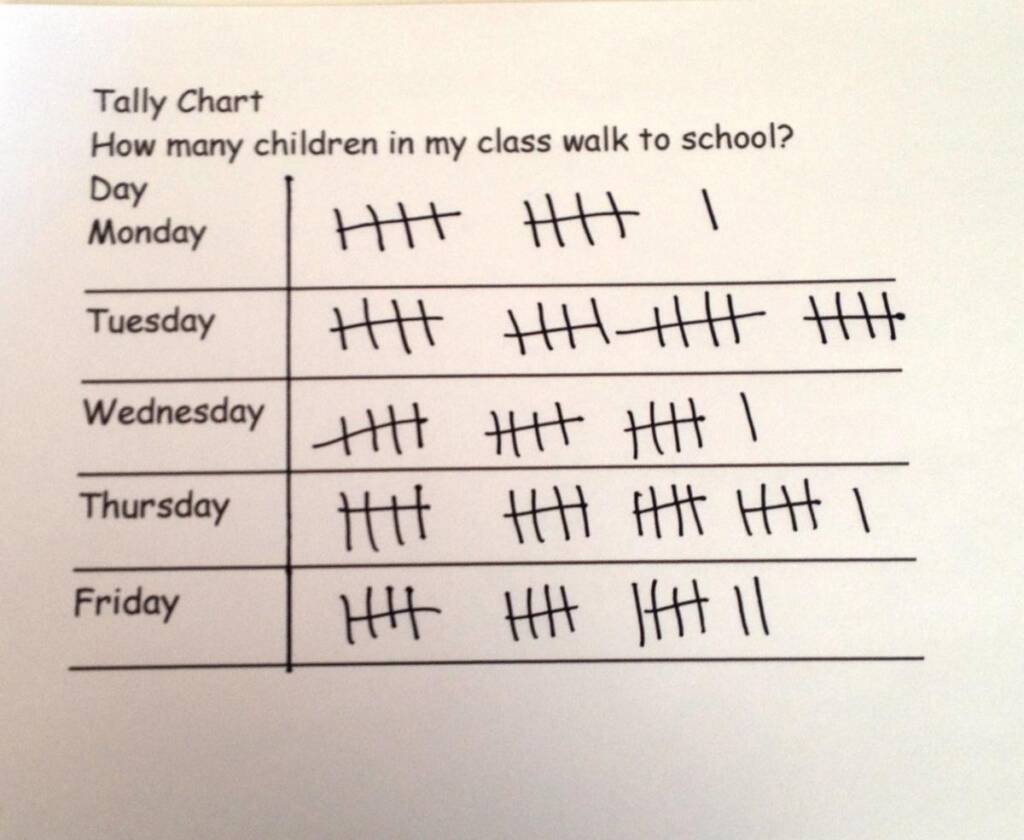
Primary Tally Charts (tactile and large print) illustrated together
Tactile Tally Chart made on embossing film, positioned on geometry mat.
Sample question:
How many cars and bikes came into the garage for petrol and to be mended?

(Using tally charts supports the child’s social skills, particularly if the questions are ones they can ask their classmates.)
Primary—Tally charts
Tactile tally chart
Made on embossing film, in table format, with a slightly more advanced recording system introduced. Braille is produced directly onto the embossing film. Lines of the table are drawn with a biro directly onto embossing film. Embossing film is positioned on a Geometry Mat, (RNIB) lines drawn with a biro create a raised line.
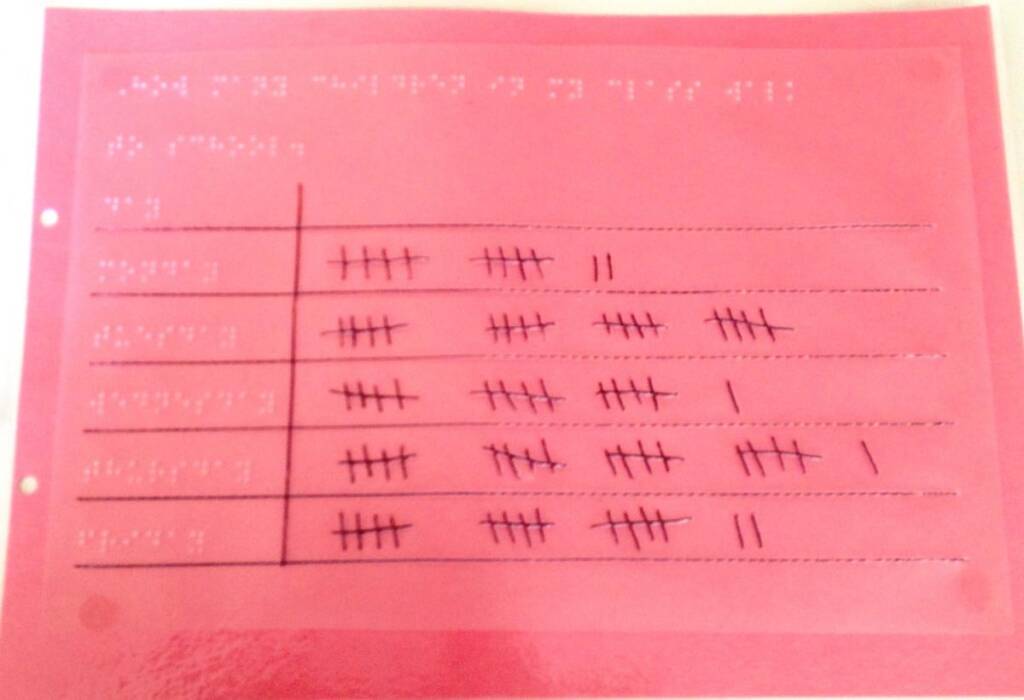
Large print tally chart
Secondary—Tally Chart Tactile
Tally chart using the letter ‘l’ to represent one, e.g. 10 skips: 5 ‘l’s’ in a group—space—5 ‘l’s in a group—space-5 ‘l’s in a group
Secondary—Tally Chart Large print

Bar Charts
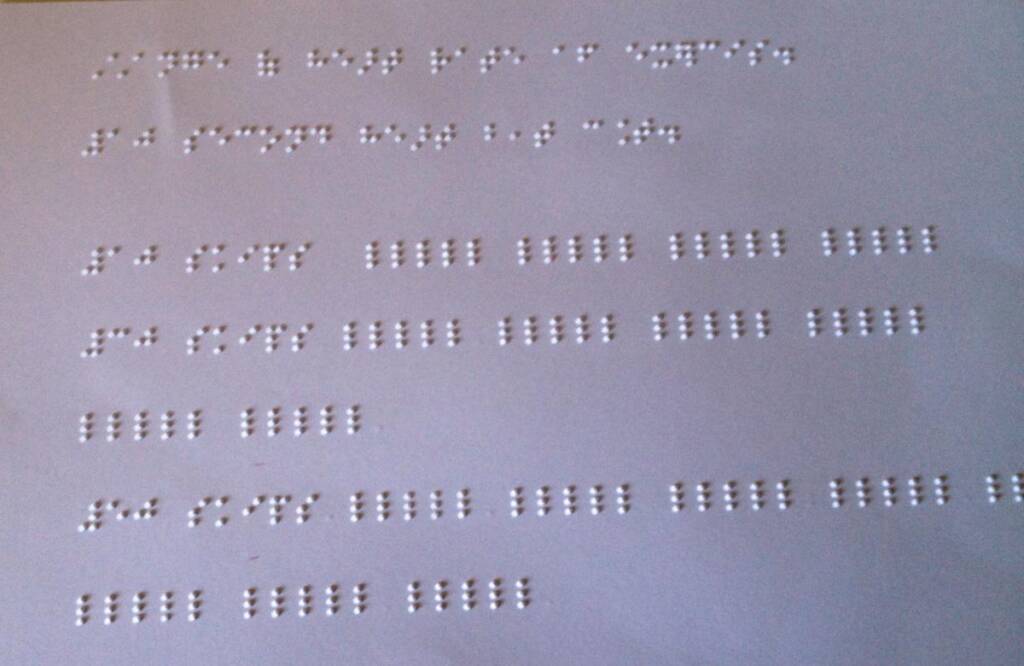
Primary Bar Chart – tactile version
Braille version made using Perkins braillewriter to create the lines. Braille numbers added directly using Perkins. Foam squares used to make the bars of the graph.

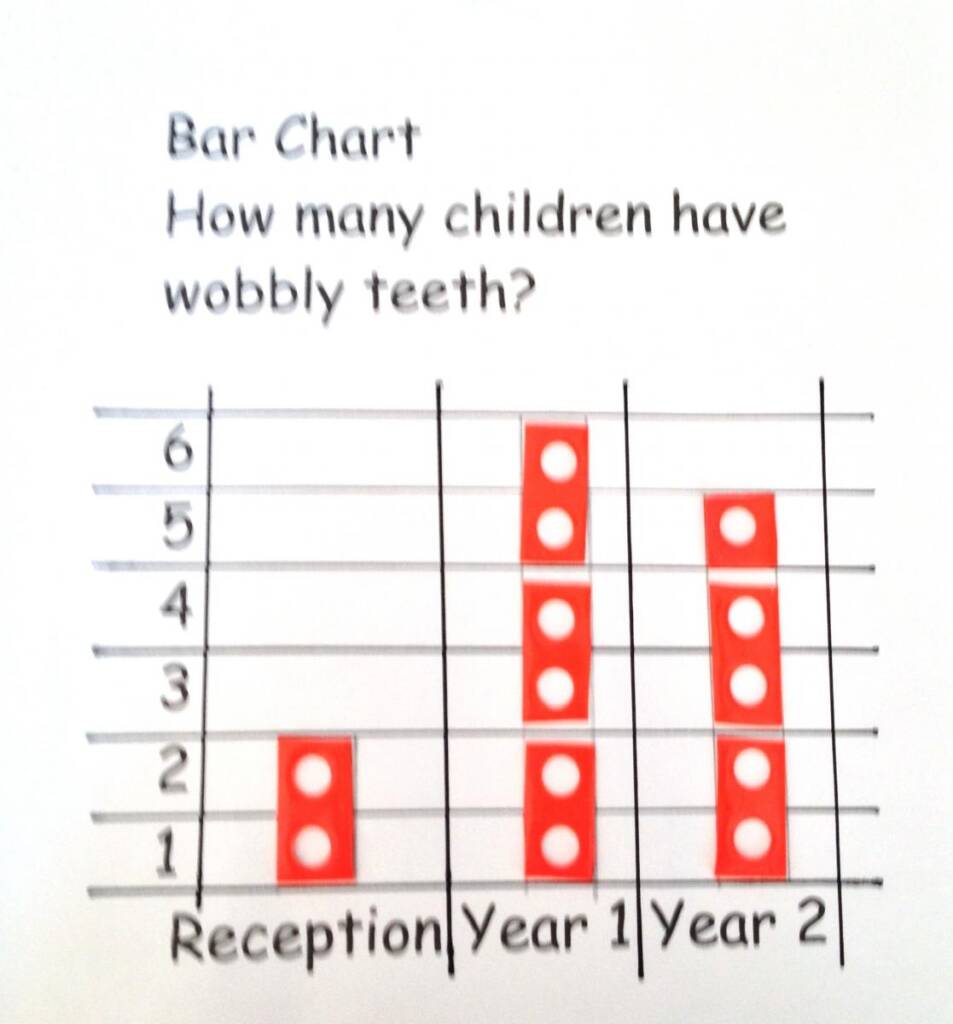
Large Print Bar Chart
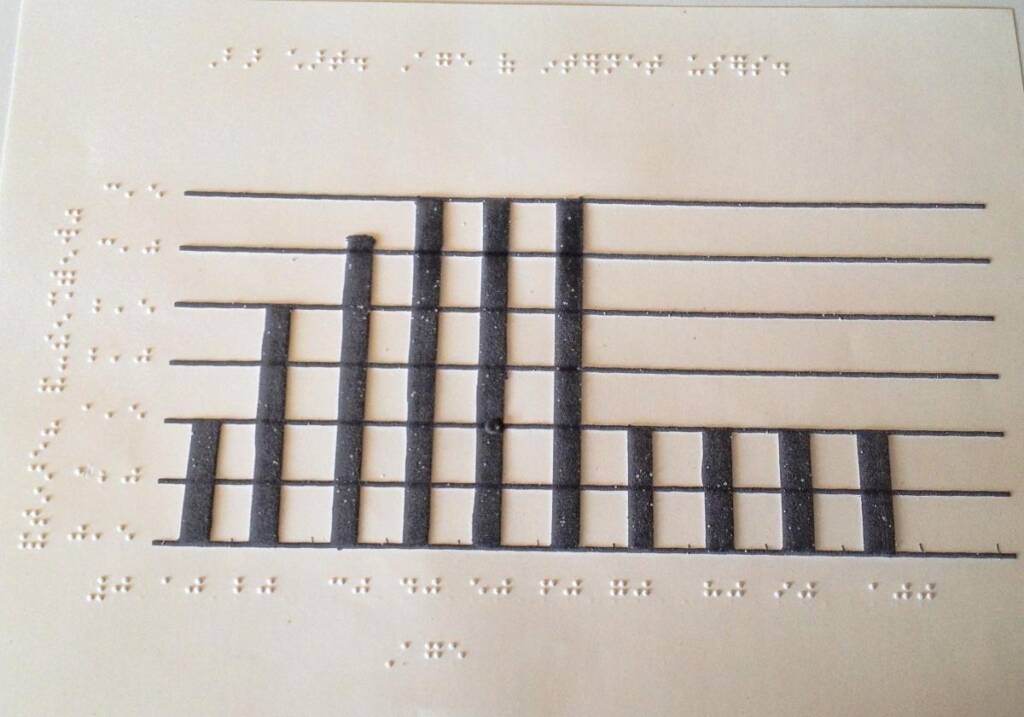
Bar chart—Secondary Tactile version
On Zyfuse paper. Image prepared on Zyfuse paper and then passed through a heat machine (Zy-fuse machine) Braille added directly onto paper.
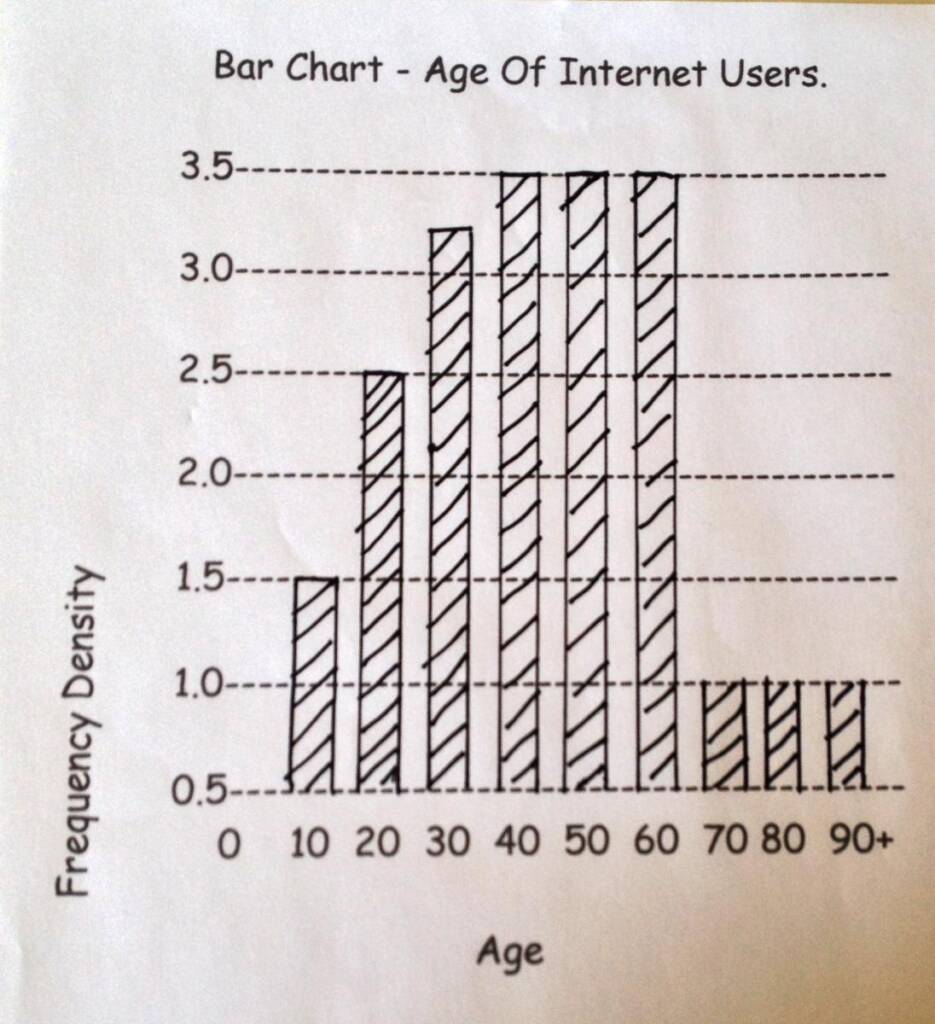
Bar Chart – Secondary Large Print
Co-ordinates
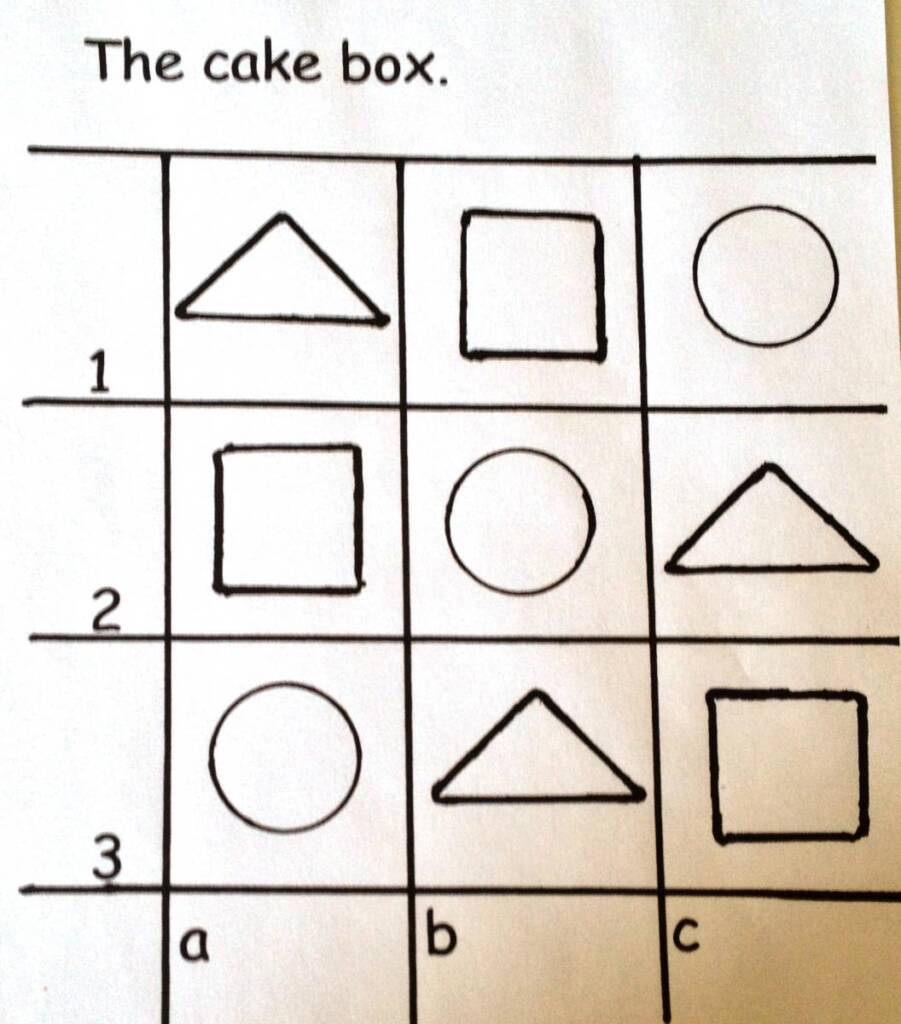
Primary—co-ordinates
Find where the cakes are. What shape are the chocolate cakes? Find 1a, 2c, 3b.
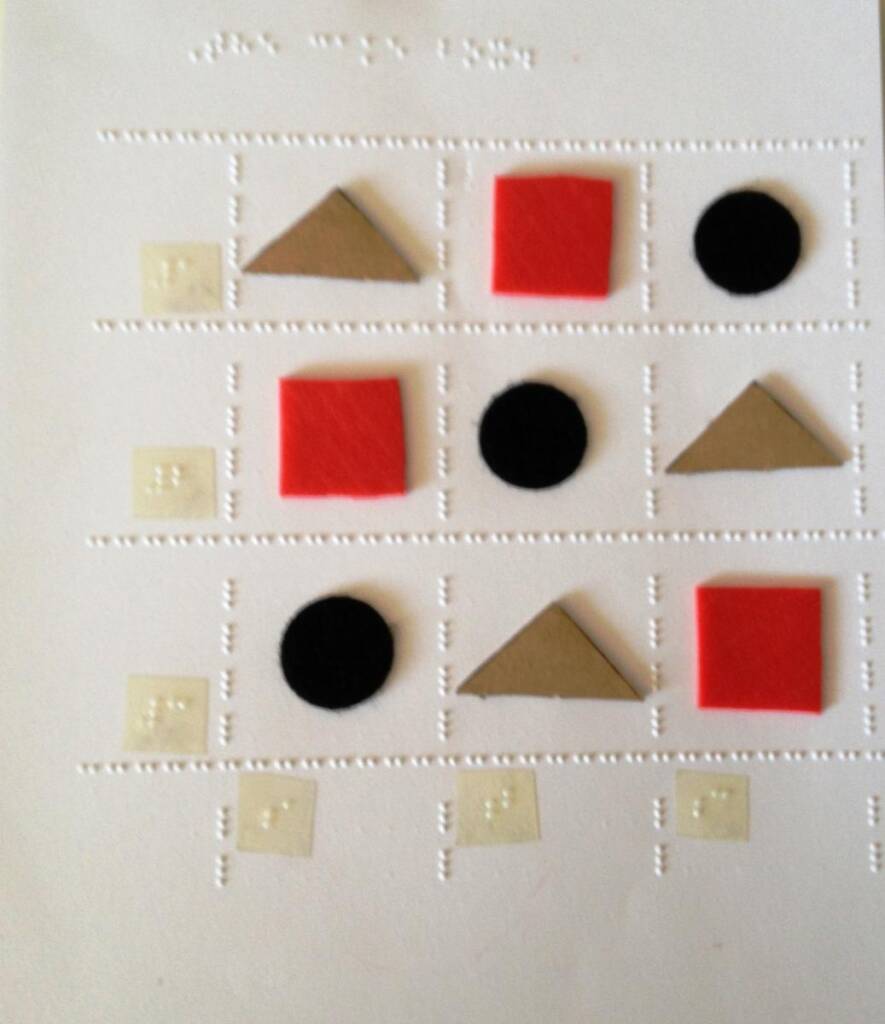
Graph lines brailled directly onto braille paper using the Perkins. Braille numbers added on large print graph sticky back braille, felt shapes used to represent cakes, stuck on with double sided tape.
Large Print Co-ordinates
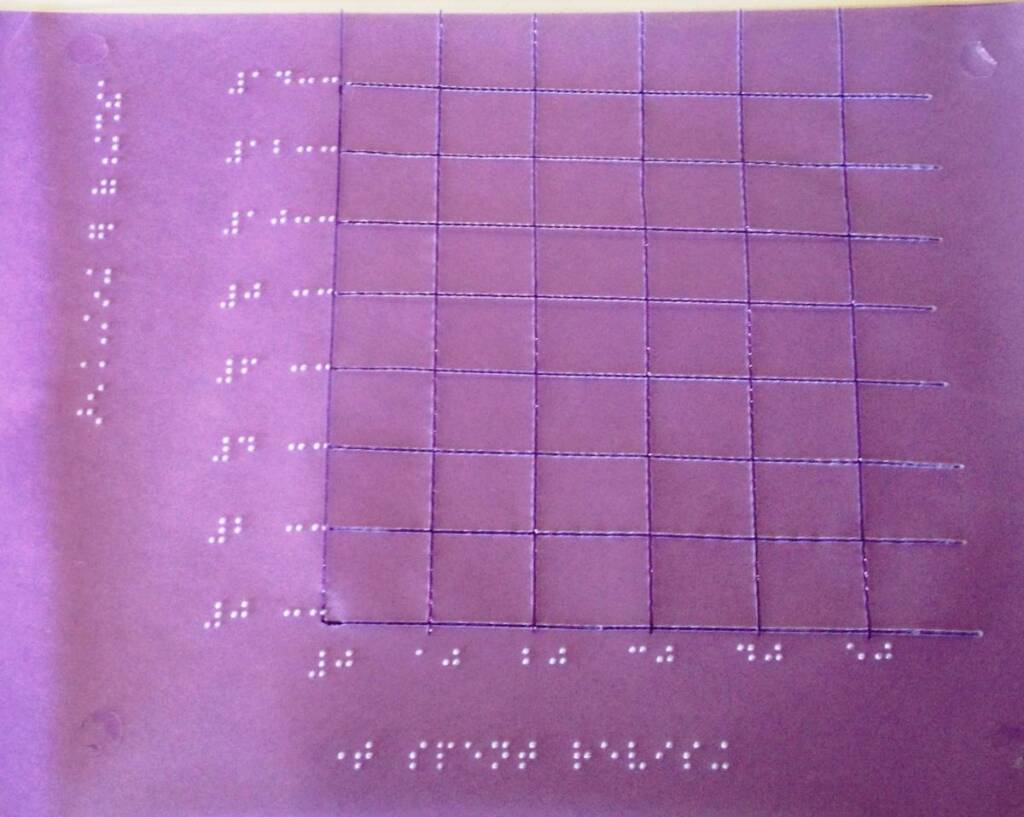
Secondary—co-ordinates
Tactile
On embossing film, lines drawn with biro, with embossing film positioned on geometry mat. Braille added directly onto film using Perkins braillewriter. Co-ordinates can be plotted by positioning the embossing film on a cork mat using mapping pins to identify the locations.
Large print version of co-ordinates
Line Graphs
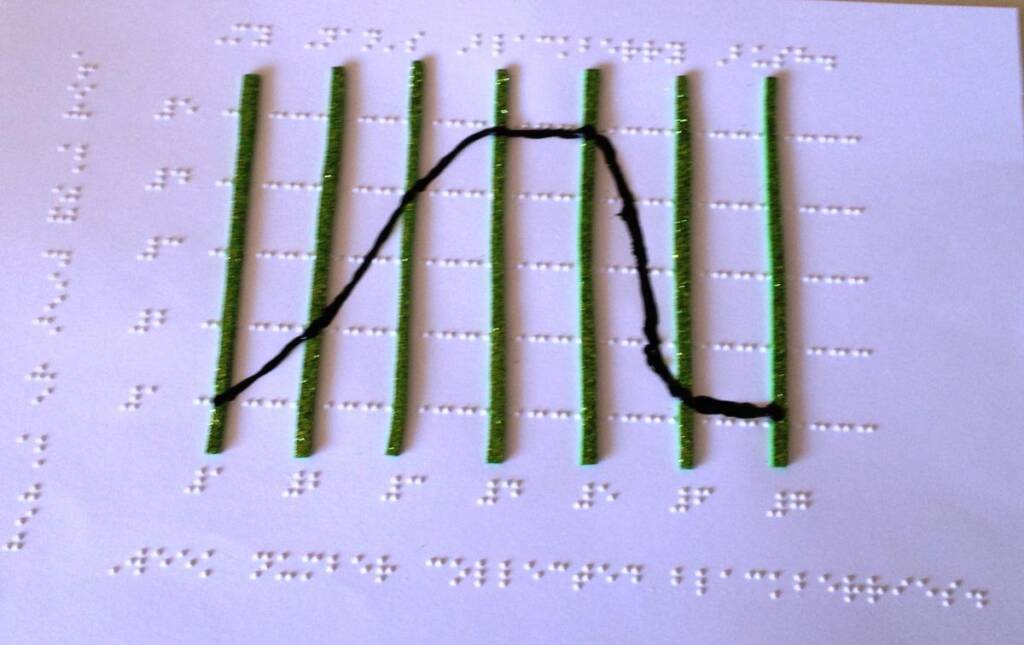
Primary—line graph
Tactile
Lines brailled with Perkins braillewriter. Thin strips of foam (pipe cleaners) used to highlight the columns, hi-mark used to indicate graph line braille numbers added using Perkins braillewriter.
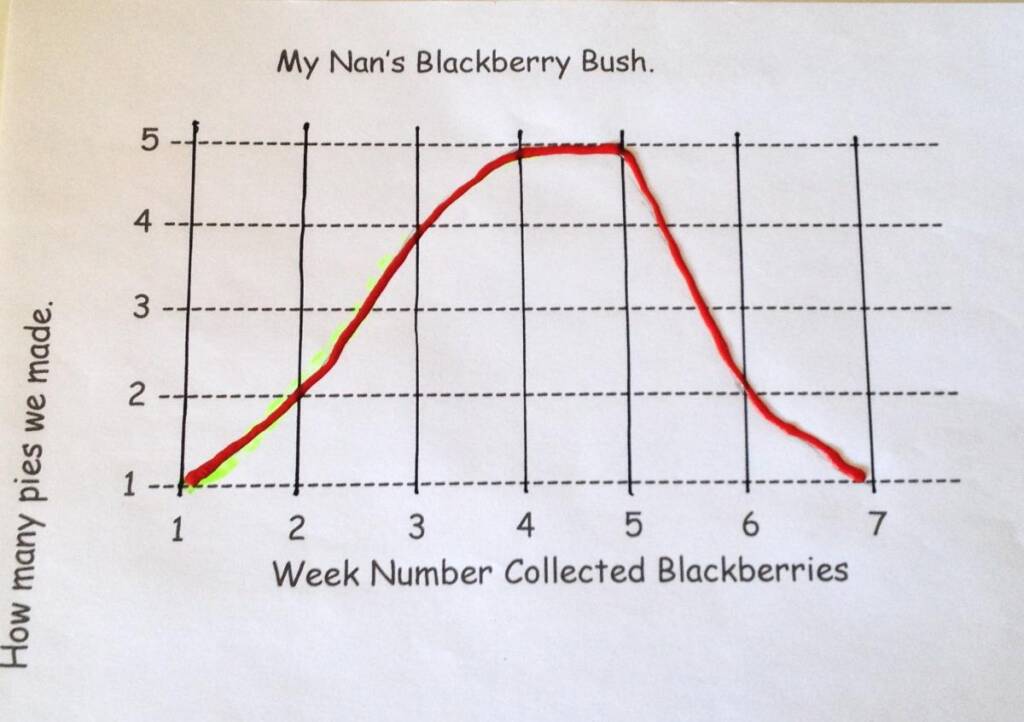
Large print version of line graph
Hi-Mark used to indicate line.
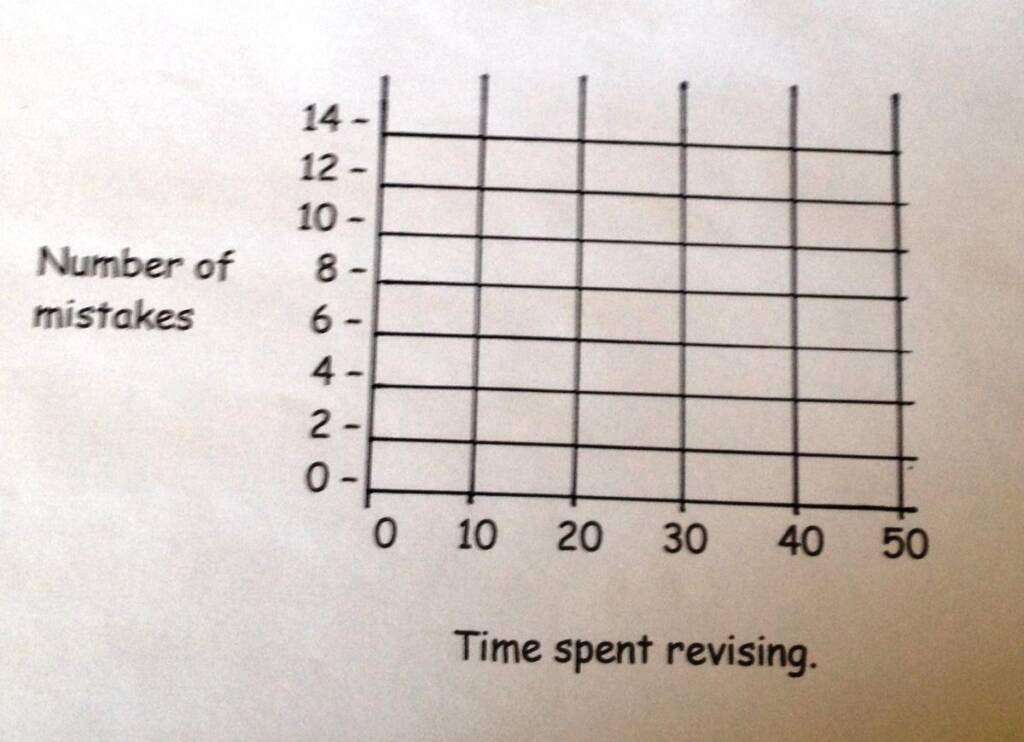
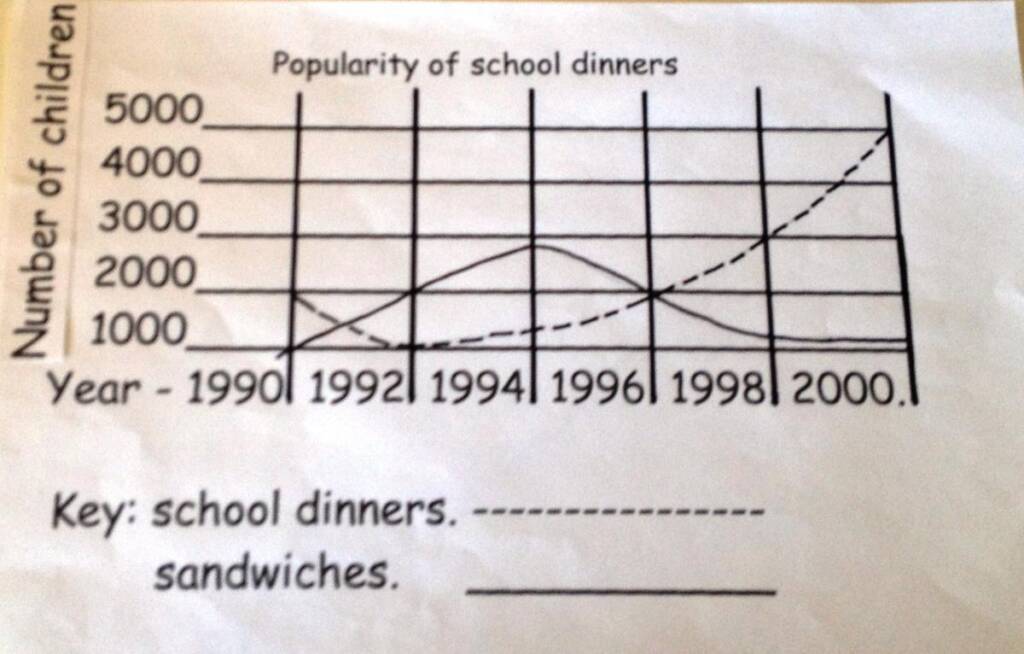
Secondary Line Graph
Tactile
Grid lines made using Perkins braillewriter, braille added directly using Perkins. Two types of line materials used to show clear distinction between the two. (Hi-Mark and foam strip, Wikki Stix could also be used.)

Large print version of line graph
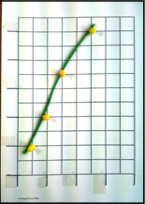
Tactile Line Graph
Made with Zyfuse paper passed through the Zyfuse machine to create raised lines, line of best fit made with Wikki Stix and pins. Graph paper positioned on a cork mat to perform this task.
There are more ideas for resources at https://positiveeye.co.uk/