 You’ve got to think outside of the box!
It’s NOT about being pretty!
It’s NOT about looking exactly like the print!
It IS about being meaningful!
It IS about being understandable!
Our responsibility is to provide accurate and readable graphics. We must ensure the student’s understanding of the concept being taught.
Standards for Tactile Graphics:
BANA Standards: http://www.brailleauthority.org/tg/
This document is 362 pages long, so I’ll provide some highlights that I believe are important to consider.
Standard Highlights:
- “No diagram should be routinely omitted if a viable method can be found to render it tactually comprehensible”
- “On the other hand, diagrams that do not add additional, necessary than what is stated in the surrounding text, may be omitted”
- “A print graphic may be simplified as long as the original intent is not compromised.”
- “The age and experience of the reader must be considered when designing a tactile graphic”
- “A tactile graphic is a representation of a print graphic designed in a manner that is the most meaningful to the reader. It is not an exact reproduction.”
- There is an excellent decision tree on page 1.8 of this document to help you decide if a tactile graphic is needed
Things to Consider…
- The age of the child
- The child’s tactile awareness
- Has the child grasped the concept?
- What is the assignment’s expectations?
- What are we testing the child on, their tactile awareness or understanding of the concept?
We must pre-teach and review as needed. We as TVI’s have to learn to balance preparation for student’s to successfully take the standardized tests with ensuring comprehension during everyday instruction time.
Examples of What NOT to Do:
- Thermoformed exact copy of print

- Tiger embosser of exact picture

- Messy or sloppy handmade graphic
- We must be careful with the Draftsman, Quickdraw paper and the Blackboard tools. These can be good and bad. You don’t want to use them for all graphics. I like having them in the classroom for two reasons. The first is to allow the general education teacher the ability to make a quick last minute drawing during “teaching moments”. For example, drawing a shape on the board to demonstrate where the hypotenuse of the triangle is. The second reason is when kids are learning to draw shapes and angles themselves.
Utilize pre-made graphics from APH via GIMC* using Quota funds
- Braille transcriber’s kits
- World and US Maps Atlas
- Anatomy Atlas
- Geometry Tactile Graphics Kit
- Basic and Life Science Tactile Graphics
- Sense of Science Plants and Animals
*GIMC is the Georgia Instructional Materials Center. Check to see what is available in your state.
Additional materials used when making tactile graphics:
- APH on Quota: graphic art tape, graph paper, braille paper, Perkins Brailler, symbol stickers, letter and number stickers and textured paper.
- Additional items bought at stores: Puff paint, card stock, textured stickers (find in hardware section) and craft glue (I prefer the mono-aqua glue).
- Tactile Image Library: http://www.aph.org/tgil/
Types of Graphics:
- Collage graphics

- Embosser created graphics


- Thermoform graphics using swell paper (we call the machine a “toaster” sometimes)

- Graphics made from a template or mold onto the plastic paper (what you most see in textbooks)

Levels:
The type of graphic should match the level of the child. This list goes from simplest to most complex.
- No graphics – all manipulatives
- A mixture of simple graphics & manipulatives

- Graphics using very distinct lines with little to no additional features


- Graphics incorporating labeling using symbols and textures with a key


- Graphics incorporating labeling using letters and numbers in braille with a key
- Graphics incorporating lines of differing thicknesses and texture.

**All depends on age and level of child!
Steps When Deciding How to Make a Graphic:
- What is the age and tactual ability of the child?
- What is the purpose of the graphic?
- Does the child understand the concept?
- Are there pre-made graphics available?
- What materials do I have available?
- Does my graphic aid in tactual discrimination? (I like to close my eyes and touch it myself)
- Pre-teach or expose to student if needed before throwing it at them in class.
Additional Examples:
- Bar Graph with Different textures for each bar. This graph was made using publisher, then printed onto swell paper. Then additional lines and dots were added using a pen before heating the paper in a thermoform machine.


- An example of two different ways to create graphics. The first was created using publisher then printed on a Tiger Embosser. The second was created using a pre-made tactile outline map of Georgia from the APH Braille Transcriber’s Kits. Then the information was created using puff paint and tactile sticker dots. Not all of the information is represented in the second map, but it gives you the idea of different ways you can create graphics even without expensive equipment or software.


- This is an example of when you have to sometimes talk to the teacher about the assignment. There is a lot of information represented on the print map of “The First Nations of Canada”. Talk to the teacher and look at the assignment before creating the graphic. Find out what information the teacher wants the student to know and what they will be tested on. You can have the teacher highlight what is necessary like in this picture.

Then create the graphic. In this case, an outline of map of Canada was made on swell paper. This was made without software. In this case, a labeled map of Canada was found on the Tactile Image Library and then just copied onto swell paper. Then, tactile stickers and symbols were used to represent the information on the map along with a key.


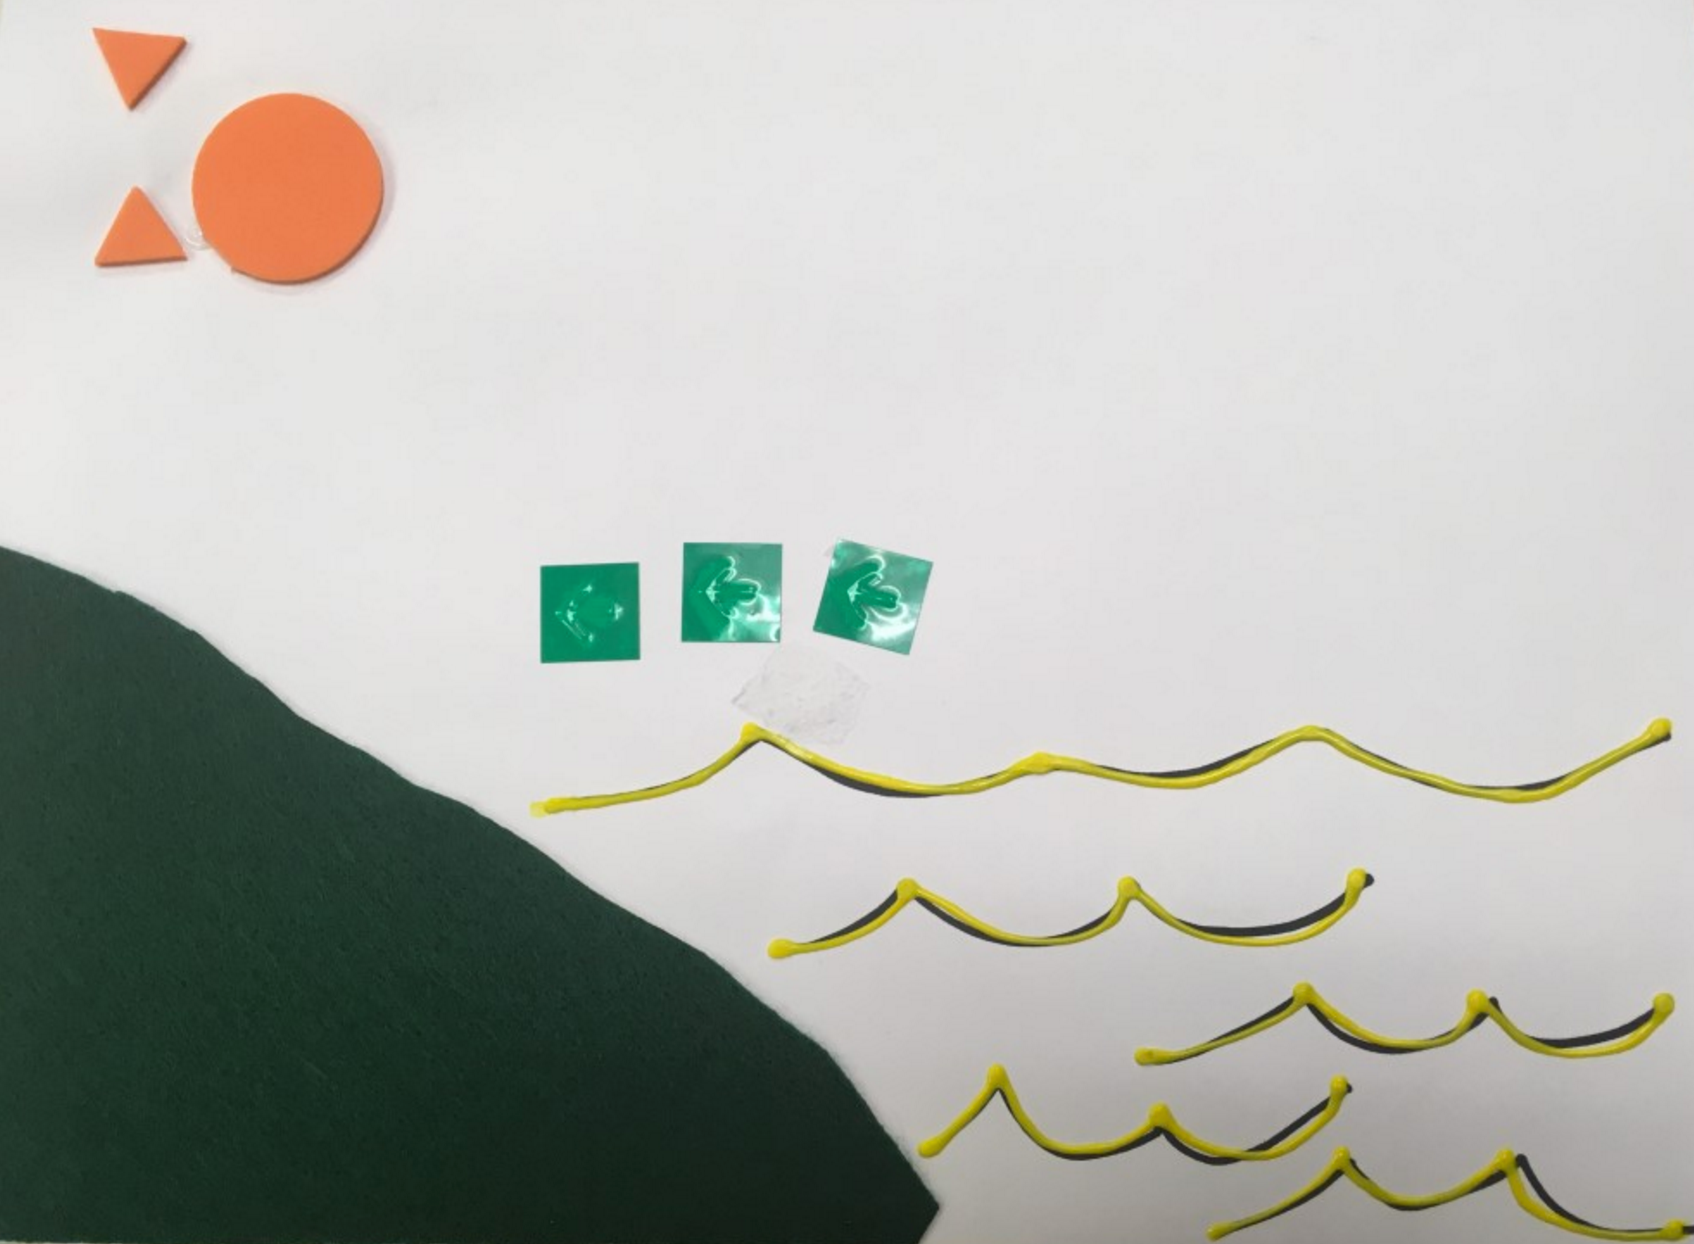
- This example also shows two ways to create a graphic. The first was created on publisher then printed on a Tiger Embosser. The second was created all by hand in a collage method using felt, foam shapes, puff paint and symbol stickers.